

This page contains the text from the handout for the Forecasting the Weather Class that I teach. The pictures from the slides shown during
the class follow the text. Reference material that was used in preparing the text for the class appears near the bottom of the class text under tools
and on-line references.
The area around Greene, NY was hit by 2 floods in 2006 (6/28-29/2006 and 11/29/2006). This was the initial drive to give a discussion on weather
that was open to the local community in order to raise awareness of weather and flooding. The weather class resulted from this initial idea.
The windvane above is mounted outside the house on a long pole. I made it a few years ago, for more information
on the metalworking see the Metal Working Page on this site.
Another weather related project of interest is the ULF/VLF receiver that can detect lightning at great distances.
Information on it can be found on the RF Electronics Projects Page.
This picture is of the sky when a very strong cold front passed through near home one afternoon this summer. The boundary between the weather system was quite dramatic and clearly visible in the sky. The temperature dropped about 20 degrees F in 30 minutes with the passage of the front.

I have also been working on some temperature data logging. It has enabled me to track the outdoor temperature for days at a time. It has allowed a close look over time of some sharp cold fronts that have passed through the area. More information on data logging can be found on this site at the Temperature Data Logging page.
Further Reading
The following link is to the National Weather Service Jetstream Online School for Weather. It is worth looking at to learn more about weather. It is laid out in topics that can be studied
one at a time. Each topic can be considered to be a short class that can stand by itself and
can be covered in the same time period as a single class would normally take.
See the links page on this website as well.
Introduction- Weather can be predicted to a degree by simple observation of the sky. This can be enhanced by keeping track of the barometric pressure. With a little effort in noticing what is going on in the sky and observing the trends, good predictions can be made. Comparing guesses against what is reported by the weather services is a way to help refine predictions. Knowledge of the climate itself, in general and the local effects helps to connect a person with the cycles of the earth and how they are coupled with the weather.
In the end all weather is caused by the sun ( also much of the energy we use came from the sun, think about it). Weather is modified by the earth's rotation, land masses, mountains, ocean current and ground temperatures.
Global air circulation-
The basic idea is that warm air rises and cold air falls. One
would expect that the warm air from the tropics would rise there and move
northward to fall back down at the poles. And the cold air at low altitudes
would go back toward the equator. This is the simple one cell (Hadley Cell) model.
In reality the warm air only makes it part of the way up
from the equator (~ 30 degrees lat.) before falling, the Hadley Cell. From the poles to 60
degrees latitude there is a circulation cell where cold air circulates from the
poles to 60 degrees rises and move back towards the poles, the Polar Cell. Between these is
another circulation cell from 30-60 degrees between the others (Ferrel cell), with air moving down at 30 and up at 60.
This splits the northern hemisphere into three circulation cells, aligned roughly with the boundaries of the
arctic, temperate and torrid regions.
Simplistically, air rises near the equator( Low Pressure) sinks near 30 degrees (High Pressure). Rises near
60 degrees (High Pressure). Around the equator, plus or minus a few degrees depending on summer and winter,
the region of semipermanent low pressure band that encircles the Earth. Thunderstorms and heavy rains occur
within this band. This moisture is responsible for the rain forests and jungles of the equatorial region.
Around 20-30 degrees North and South latitude there are regions of semipermanent high pressure that is
responsible for most of the deserts of the world.
Summary of air circulation at ground level

Latitude Deg. N    Behavior          Pressure        Comment

90(North Pole)     Divergant-Sinking     H           Cold and dry.
60                 Convergant-Rising     L           Location of Polar Cold Front - Polar Jet Stream rides here at high altitude.
30                 Divergant-Sinking     H           Deserts located 20-30 Degrees - Main Jet Stream rdies here at high altitude.
0                  Convergant-Rising     L           Stormy region, thunderstorms, tropical rain forests.
The fact
that the earth is spinning adds yet another modification to this. The spinning
earth twists the movement of air from a north-south circulation to a prevailing
movement of easterlies and westerlies. For our temperate region a general
westerly flow prevails, for the
The twisting effect on the winds is called the Coriolis effect. A wind that would
be expected to move from High to Low pressure in the Northern hemisphere is
twisted to the right. The higher the speed of an object( air as wind in this case)
and the closer to the poles, the stronger the effect.
Fact: On a weather map the winds follow the lines of equal pressure (isobars) at high
altitudes. The closer the isobars are to each other the stronger the winds.
The earths spin also modifies the local wind
direction around high and low pressure systems. This is caused once again, by the Coriolis
Effect. It causes wind at high altitude to circulate clockwise around high pressure systems and
counterclockwise around low pressure systems. Near the ground wind direction is modified slightly
by the drag caused by the Earth's surface and other objects. It is modified in such a way that wind
points slightly away from the high pressure center and slightly towards the low pressure center.
I will leave it at that, to go any further on this topic would require vector math.
Summary of winds in the North Hemisphere

Latitude Deg. N    Prevailing Behavior                 Comment

60 - 90            Polar Easteries
30 - 60            Temperate Westerlies
~30                None                                Calm - Horse Latitudes - Why the name?
0 - 30             Tropical Easterlies                 Trade winds
~0                 None                                The Doldrums
Pressure
Trends and Weather
High Pressure - Typically cooler, dryer, fair skies. Winds rotate clockwise around high pressure centers. Wind speed depends on how 'steep' the slope is between high and low. The air is sinking within areas of high pressure; causing it to be denser.
Approaching High - Bad weather breaking up. Pressure rising, winds shift to the North or Northwest. Cooler/ Drier.
Arrived High - Clear skies, possible fair weather puffy clouds. Low Humidity, calm winds. West if the High is to the south, east if to the north. Stable temperatures, cool nights, clear. Pressure High and stable. Contrails dissipate quickly during the day. Crisp stars and moon.
Leaving High - Warmer, winds shifting the South or Southeast. Warmest temperatures. High thin clouds make an appearance, contrails stay in the sky. Moon appears surrounded by a ring or blurry.
Low Pressure - Warmer, wetter. The air is generally rising within areas of low pressure. Winds rotate counterclockwise around low pressure centers. Wind speeds once again depend on steepness of pressure difference between high and low. Low pressure areas form between areas of high pressure and tend to form along weather fronts. Sometimes several of them will be located along a front that covers a large distance.
Approaching Low- Warmer, winds any where from NE to S, typically S or SE. Increasing is speed for a while then settling down. High clouds thickening, ground glass sky. Finally lowering and thickening to obscure sky.
Arrived Low- Calmer winds, rain starts lightly at first then steady.
Leaving Low- Spotty precipitation winds shift to the North or Northwest. Cooler/ Drier. Going back into approaching high.
The cycle of High to Low and back is approximately 5-7 days. This roughly coincides but is not related to the moons phases.
Fronts
Fronts form along boundaries between weather systems of different temperature and humidity. Fronts separate two different types of weather.
The winds are generally going in different directions on each side of a frontal boundary. The following is a basic rundown of the most common fronts that occur in our area.
Cold Front - Cold air displaces warm by wedging underneath. This forces air higher and higher generating tall clouds associated with thunderstorms and snow squalls in the winter. The higher the altitude, the cooler the air is. More and more moisture that is present in the air condenses at high altitudes. Water and ice particles eventually can reach a size that will fall as precipitation.
In a thunderstorm a chimney effect causes more and more warm air to rise quickly, condensing rapidly, resulting in heavy precipitation. The cold front passage is marked with a line of energetic weather and gusty winds that shift direction as the front passes. In the more energetic systems hail can form as the back edge of the thunderstorm passes through a region. The temperature will also drop rapidly. Gusting winds will occur and change direction as the front passes.
Warm Front - It is more difficult for warm air to displace cold. It tends to ride up over the cooler air and it displaces it gradually over a period of days. The progressions of clouds signaling an approaching warm front are as follows. High thin stratus (layer) to thicker and lowering stratus from which precipitation finally falls. The initial approach of the warm front can be detected by observation of clouds. First high thin clouds and/or high herringbone (cumulo-stratus) clouds will appear, contrails will begin to stay in the sky. This is a sign of upper level moisture in the atmosphere. The clouds that follow will lower and thicken as the warm air displaces the cold air. The temperature will rise slowly and when the clouds cover the sky fully (nimbostratus) precipitation will fall.
Weak Fronts - A weak cold front may pass causing a slight drop in temperature, with some wind and clouds that move fast through the sky. This would normally end in clearing skies. Typically associated with high clouds. Very high clouds that are high enough exhibit curvature.
A weak warm front may produce days of cloudiness with no rain.
Stationary - Produces the same weather, good or bad for an extended period of time, sometimes days. The fronts stay put, therefore the weather stays the same.
Occluded - Cold fronts generally move faster than warm fronts. Therefore they can overrun a warm front. The cold front can drive itself under a warm front wedging it aloft. This forms a triple point where both fronts converge. Occluded fronts can occur in the vicinity of mature low pressure systems.
Climatology
Sun angle and its effects - The position of the sun moves from the equator at the vernal equinox to 23.5 degrees North on the summer solstice back to the equator on the autumnal equinox, to 23.5 degrees South on the Winter solstice.
The noon peak sun angle in degrees is related as follows, assuming we are at 42 degrees North is as follows. Equinoxes, 90 - 42 = 48, Summer solstice 48 + 23.5 = 71.5 Winter Solstice 48 - 23.5 = 24.5. This coupled with the length of day at 9:05 hrs Winter Solstice, 12:11 at the Equinoxes, 15:15 at the Summer Solstice, gives the amount of solar energy reach the face of the earth.
The sun angle and length of day combine to influence heating of the earth, ocean and atmosphere. This heat is uneven from place to place and tends to make the air want to move around the earth as discussed earlier with reference to global air circulation.
Many times when the sun goes down the winds calm as the air is no longer driven by convective heating. At night the cool air tends to fall and will travel downhill, in the morning this trend reverses.
Inertia - Average temperatures lag the seasons by about 36 days. The lowest average temperature for the winter season here will occur Jan 27, 2007. The maximum average summer temperature will occur July 27, 2007. The maximum rate of change up will be Apr 25 and down will be Oct 29 respective to the equinoxes. This lag is due to the fact that the ground and water bodies retain heat and that the atmosphere being a giant ocean of air cannot respond immediately to changes either. On a daily basis there is a lag also, it warmer somewhat later in the afternoon rather than at noon when the solar radiation reach the earth is the most powerful. This lag is present in most large scale natural systems.
Average Temperatures (Deg F.) for
         L   H    A
1/27 -   5   23   14
4/25 -  33   51   42
7/27 -  62   80   71
10/29 - 32   50   41
Seasons - The length of the seasons are not equal, 3/20-6/21 = 93 days, 6/21-9/23 = 94 days, 9/23 - 12/22 = 90 days, 12/22 - 3/20 = 89 days. This is due to the sun being further away in winter, peaking in distance at about January 5th. It takes it longer to cover the same distance in space over the winter, lengthening winter with respect to summer.
Using a computer program to obtain the rise and set time for Binghamton NY and Asheville NC, I derived the following chart. It compares the two locations and shows the difference in sun rise/set and length of day between them.
Asheville (82.57 deg W) lies West of Binghamton (75.75 deg W) So the day is shifted to favor the sun rising and setting later by an average 33 minutes. Clearly the greatest difference is near the Winter solstice where it sets almost an hour later. The length of day is not as short in Asheville as it is in Binghamton at the Winter solstice. Good news for solar heating and Seasonal Affective Disorder sufferers!
At the equinoxes, only Spring is shown, Fall would be identical, the length of day for both is nearly equal.
The data shows that at the Summer solstice there is little difference as well. In my mind I would have expected more spread in the rise/set times and length of day between the two cities in the summer as well, with Binghamton winning the day length competition. But the data reveals otherwise.
Sun Rise/Set, Length of Day Comparison.
Binghamton NY -v- Asheville NC Times in EST
Differences (Asheville - Binghamton) in minutes


Date         Location       Rise    Set    Length
3/20/2007    Binghamton    06:02   18:08   12:06
             Asheville     06:34   18:42   12:08

             Diff.(A-B)       32      34       2

6/21/2007    Binghamton    04:21   19:36   15:15
             Asheville     04:54   20:11   15:17
             Diff.(A-B)       33      35       2

12/22/2007   Binghamton    07:22   16:29   09:07
             Asheville     07:36   17:21   09:45
             Diff.(A-B)       14      52      38
What matters for climate as well as the length of day is the solar angle which connects to the actual amount of solar radiation energy that reaches the surface of the earth and the atmosphere as discussed above.
Climate Regions on
the East Coast - The northeast is a humid continental region, south of NJ
and PA the region transitions into humid subtropical. The Appalachian Mountains
are high enough to still be a transition region all the way to
Temperate climates extend from the tropics of Cancer and Capricorn, north or south to the arctic circles experience the four seasons. Tropical regions experience a cooler dry "winter" and a warm hot wet "summer". Some tropical regions can have three levels, cool, hot, followed by wet.
Odd/Local
Weather
Lake effects - After bad weather clears out in the winter, winds shift to the W/NW. The Great Lakes being warmer than the land and large bodies of water liberate significant moisture into the air. This condenses causing trails of clouds, think of smokestacks. The cloud trails cross this region, snow eventually falls from them as they cool and are driven over elevated land. As a typical one-two punch in the winter for our area is that, we get snow and just as it clears out, lake effect snow starts up for a period of days. Lake effect typically happens early in the winter before the lakes are not frozen. It also contributes to winter cloudiness. If the lakes were not there we would more clear days and less snow in the winter. Lake effect can cause confusion in weather prediction. The confusion is that the barometer is rising (fair weather) but it is cloudy, blowy and snowing.
Perpetual
Cloudiness - This area has the 2nd lowest rate of insolation
(amount of solar radiation reaching the earths surface), bad for solar heating!
The average amount of sun per day is 3.16 for
... which shows this off clearly. It has to do part with the prevailing westerly flow of air
across the lakes and the basin formed over the
Many times
during the spring and fall it is possible to go a short distance away from
42nd Parallel -
Folklore has is that the 42nd parallel separates different kinds of weather in
our region. This is the line between PA and NY nearby us. This roughly
correlates with the aforementioned perpetual cloudiness, lake effect possibly
also starting the trail off at this distance. Another factor is the river
changing direction at
Jet Stream-
There are actually two jet streams that form at very high altitudes. One of them,the Polar Jet Stream,rides
along the boundary between the Polar Cell and the Ferrel Cell.
The Polar cold front would lie below and to the South of it.
The temperate jet stream lies near the boundary of the Ferrel Cell and the Hadley Cell, it is
once again at a high altitude.
The jet streams are a river of high speed air that encircles the globe with
the air flowing from west to east. They can affect the temperature latitudes that we live in.
When the Polar jet stream drops to the South during the winter, we will get cold air over our
region. The converse is true as well, sometimes the loop can go up above us and stay there.
This can allow it to be mild for extended periods of time. The effect of the Polar jet stream
is more pronounced during the Winter months when it is strongest. The temperate jet stream is
weaker than the Polar jet stream and has less to do with the weather of our region.
I have read somewhere( I can't remember where ) that the jet stream certain amount of loops in it; they have to be a whole number. Sometimes it will snap to a different number, repositioning where the loop lands in the continental US. This can lead to different weather patterns. I have noticed that sometimes weather changes will happen mid-season, so that you may get a hot/dry start of summer followed by cooler/wet or the other way around. This can happen in winter as well. I have not paid a lot of attention to what the jet stream was doing at those times. It is something I will have to look for in the future.
The following link shows graphical representations of the jet stream, both current and
forecast winds. The graphs are shaded to show wind speeds above 60KMH. There are also
graphs of the jet stream winds superimposed on satelite images.
CRWS Jet Stream Map Menu
I have observed a pattern.There is a distinct 2 year pattern; generally bad winters come 2 in a row. This might be related to the jet stream or El Nino/La Nina. Certain winter/summer patterns can couple in this way as well, extreme winter/summer, 2nd half of summer extreme, 1st half of winter extreme or just the opposite. I would like to know more about this myself, I am as always open to ideas.
Noreaster - A
coastal storm where the low pressure is off of the east coast of the
Floods - Floods are the biggest natural disaster threat in our area. Most deaths occur from floods in this area than from any other natural disaster. Floods can occur at any elevation when a quick heavy storm occurs. Culverts overflow and cause water to take paths that it normally would not. Flooding is compounded in poor drainage areas and when the ground is saturated.
Main stem and river flooding typically involves low lying flood plains. Rain over many days, snow melt and a saturated ground all set up the potential for this type of flooding.
Things to
look for
If contrails stay in the sky there is upper level moisture forming. Precipitation will generally be arriving in 2-3 days. This will sometimes be followed by herringbone clouds and a ground glass look to the sun or moon which is further evidence of bad weather approaching.
If smoke from chimneys stays low and birds fly low, precipitation is approaching soon.
Winds from North to Southwest mean fair weather, South to Northeast fowl weather.
A clear night and fog in the morning generally mean a rain free day.
The air in front of a thunderstorm or an isolated heavy rain cloud is generally sinking and calm, when it starts to gust there is only a minute or two to take cover.
Tools
Temp/Hum/Barometer
- Many models are available relatively inexpensively today. Digital ones
are available from many sources for under $100. Local sources include Radio
Shack,
http://www.hometrainingtools.com/catalog/earth-space-science/weather-climate/p_as-digwbht.html- $40
Cloud Identification and Weather Book
http://www.hometrainingtools.com/catalog/earth-space-science/weather-climate/p_bk-weatwiz.html- $9
Cloud Chart 17 inches X 22 inches
http://www.hometrainingtools.com/catalog/earth-space-science/weather-climate/p_as-cloud.html- $4
Weather Radio & Warnings - Inexpensive ones can be bought that have programmable alerts. These alerts only sound when threatening weather is moving into your county. Some are built to trigger different levels of alert depending on the severity of the approaching weather.
Watch - Conditions are
favorable for ________.
Warning - _______ is occurring,
imminent or highly likely.
Advisory - Hazardous
weather conditions are occurring, imminent or likely. Conditions will cause a
significant inconvenience and if caution is not exercised...(Advisory is not as
urgent as a warning.)
Online
References
Short term map
forecast for 0000 and 1200 UTC, 8AM and 8PM EDT.
Shows High & Low Pressures, precipitation, fronts and pressure isobars for continental US.
Good to use to compare reading the clouds against what is happening on the weather map.
Text based
forecast for our zone.
Contains...
Zone Forecast for
State Forecast for
Area Conditions for
Nearby Cities- Sky, weather conditions, temp, dew point, relative humidity, wind speed and direction, barometric pressure and remarks.
Climate data from
the entire US.
One file is a PDF the others are the same data broken down by category in a text file format. The text files are suitable for import into spreadsheets.
Quick one page
summaries with bar graphs for many cities.
Climate
Some further climate information, details these climates around the world.
Fronts
This one has all of the symbols for the fronts.
Satellite and
Radar images of the
http://www.weather.gov/sat_tab.php?image=ir
Severe Weather:
Warning, Watches and Advisories Defined
http://en.wikipedia.org/wiki/Severe_weather_terminology_%28United_States%29
Hazardous weather risks: repeated here
The various weather
conditions described above have different levels of risk. The NWS uses a
multi-tier system of weather statements to notify the public of threatening
weather conditions. These statements are used in conjunction with specific
weather phenomena to convey different levels of risk. In order of increasing
risk, these statements are:
Outlook - A hazardous
weather outlook is issued daily to indicate that a hazardous weather or
hydrologic event may occur in the next several days. The outlook will include
information about potential severe thunderstorms , heavy rain or flooding,
winter weather, extremes of heat or cold, etc., that may develop over the next
7 days with an emphasis on the first 24 hours of the forecast. It is intended
to provide information to those who need considerable lead time to prepare for
the event.
Advisory - An advisory is
issued when a hazardous weather or hydrologic event is occurring, imminent or
likely. Advisories are for less serious conditions than warnings, that cause
significant inconvenience and if caution is not exercised, could lead to
situations that may threaten life or property. NWS may activate weather
spotters in areas effected by advisories to help them better track and analyze
the event.
Watch - A watch is used
when the risk of a hazardous weather or hydrologic event has increased
significantly, but its occurrence, location or timing is still uncertain. It is
intended to provide enough lead time so those who need to set their plans in
motion can do so. A watch means that hazardous weather is possible. People
should have a plan of action in case a storm threatens and they should listen
for later information and possible warnings especially when planning travel or
outdoor activities. NWS may activate weather spotters in areas affected by
watches to help them better track and analyze the event.
Warning - A warning is
issued when a hazardous weather or hydrologic event is occurring, imminent or
likely. A warning means weather conditions pose a threat to life or property.
People in the path of the storm need to take protective action. NWS may
activate weather spotters in areas effected by warnings to help them better
track and analyze the event.
Weather Pictures for Class
The following are the NOAA weather forecasts of fronts pressure and weather, with a picture of the current weather outside at the time and
a picture taken of the barometer/thermometer placed on them.
They are used as a learning tool for the class on how to relate weather maps and
the actual weather over a progression of a weather event. In this case the weather went from fair on May 14,( May 13 had completely clear skies) to
rainy and started to clear up again.
Weather/Climate Data for Class
The image above shows the relationships between the Sun's position relative to the equator on a unit scale, the rate of change of the Sun's position (1st derivative) and the curve representing the daily average temperature for out area. The daily average temperature has a 'phase shift' of 36 days from the Sun's position relative to the equator.
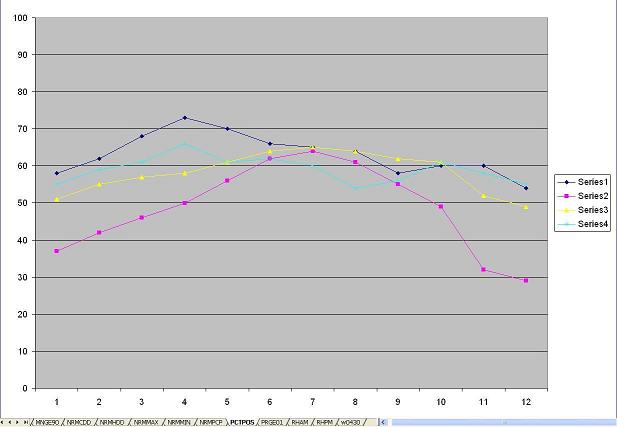
The following images are screenshots of an MS Excel document that compares the climate across 12 months for 4 locations. The raw
data was obtained from the NCDC data files. A link to this directory appears on the links page of this web site. The data files contain
data by category such as Average Snowfall and so on, for some 102 locations across the US and its territories. I followed the categories
and naming conventions of those data files.
Why bother taking screenshots of Excel spreadsheets and not just publish the XLS files,you may ask?
The reason for this is that the screenshots were made into images that were loaded onto an SD memory card that allowed viewing on a TV with a built
in card reader. Publishing them here in the same form seemed like a good idea, plus they are always ready for quick retrival!
The links below are by category and compare the statistics graphically for 4 locations. They are as follows.
Series 1 - Dark Blue Line - Gainesville,FL - Near where my Mom lives. The warmest place I have visited.
Series 2 - Fuchsia Line - Binghamton,NY - Near where I currently live, and are familiar with since 1997.
Series 3 - Yellow Line - Islip,NY - Near where I grew up and familiar with.
Series 4 - Light Blue Line - Asheville,NC- I visited this city twice, it seems like a great place to live.
As an interesting sidenote, I composed the four city comparision 'study' above upon returning from Asheville, NC in April 2007.
I thought to myself, I would like a deeper look after viewing on-line the brief average temperature chart on CityRating.com.
Well I went on-line followed some links to the NCDC website and produced the Excel sheet comparing the four locations.
Sometime after I did this I went back to the NCDC site for a more in depth look, there are some good global warming studies going on there.
To my big surprise I found out that the NCDC is located in Asheville!
Interestingly, just that sort of thing has been the experience with Asheville so far. We have had many interesting things happen in and
related to Asheville in our short exposure to it by visiting there.
![]()
Original Build Date:11-02-2007
Last updated 11-07-2007